
Press Ctrl+ and K to search
请注意,本文编写于 100 天前,最后修改于 99 天前,其中某些信息可能已经过时。
目录
一、基本使用
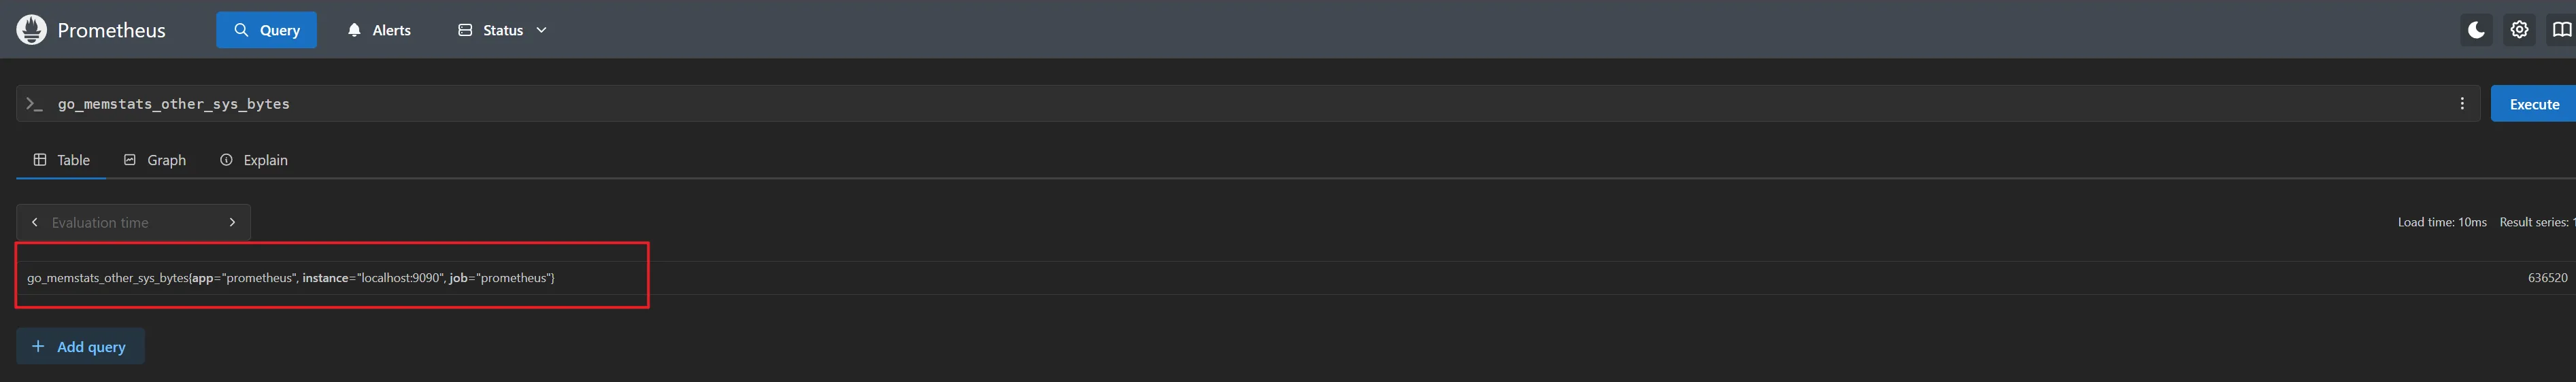
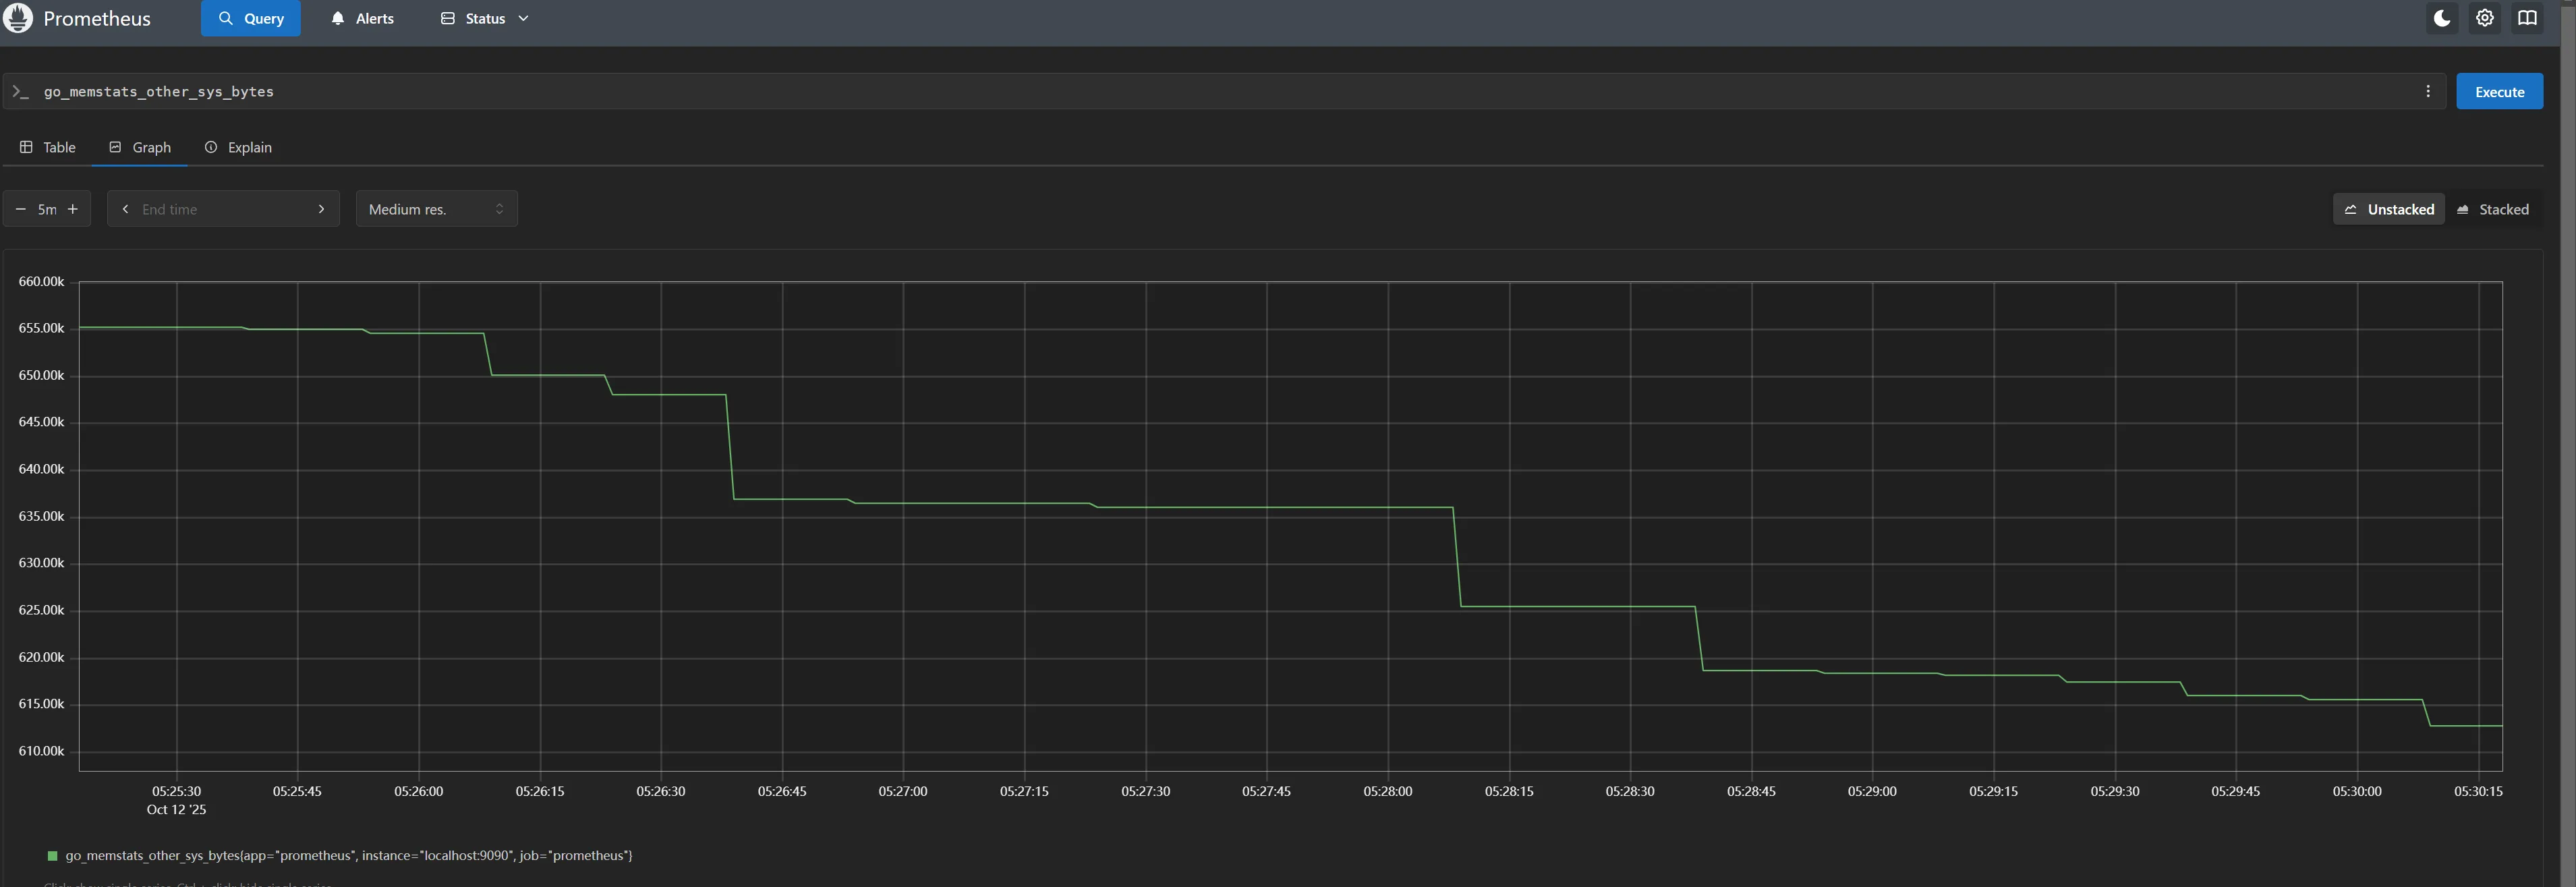
jsgo_memstats_other_sys_bytes
可以通过表的方式进行筛选查询
二、命令
查看帮助命令
js/server/prometheus/prometheus-3.5.0.linux-amd64/prometheus -h
指定当前目录下的配置文件启动
js/server/prometheus/prometheus-3.5.0.linux-amd64/prometheus --config.file="prometheus.yml"
允许IP访问,如果要允许特定IP访问修改前面的IP
js/server/prometheus/prometheus-3.5.0.linux-amd64/prometheus --web.listen-address=0.0.0.0:9090
限制最大的并发连接数量
js/server/prometheus/prometheus-3.5.0.linux-amd64/prometheus --web.max-connections=512
指定数据库存放的目录
js/server/prometheus/prometheus-3.5.0.linux-amd64/prometheus--storage.tsdb.path="data/"
日志级别
js/server/prometheus/prometheus-3.5.0.linux-amd64/prometheus --log.level=info
日志格式
js/server/prometheus/prometheus-3.5.0.linux-amd64/prometheus --log.format=logfmt
一般使用命令,可写入/etc/rc.local开机自启
js/server/prometheus/prometheus-3.5.0.linux-amd64/prometheus --config.file="/server/prometheus/prometheus-3.5.0.linux-amd64/prometheus.yml" --web.listen-address=0.0.0.0:9090 --web.max-connections=512 &>>/server/prometheus/prometheus-3.5.0.linux-amd64/prometheus.log &
三、systemctl服务管理
jsvi /etc/systemd/system/prometheus.service
js[Unit]
Description=Prometheus Monitoring System
Documentation=https://prometheus.io/docs/introduction/overview/
After=network.target

[Service]
ExecStart=/server/prometheus/prometheus-3.5.0.linux-amd64/prometheus \
  --config.file=/server/prometheus/prometheus-3.5.0.linux-amd64/prometheus.yml \
  --web.listen-address=0.0.0.0:9090 \
  --web.max-connections=512
Restart=on-failure
RestartSec=30s
LimitNOFILE=65536
StandardOutput=syslog
StandardError=syslog
SyslogIdentifier=prometheus

[Install]
WantedBy=multi-user.target
js#授权
chmod 777 /etc/systemd/system/prometheus.service

#重载服务
sudo systemctl daemon-reload

#开机自启
sudo systemctl enable prometheus

#查看状态
systemctl status prometheus.service

#实时查看日志
journalctl -u prometheus -f
四、yml文件解释
yml# 全局配置
global:
  # 数据抓取间隔(默认1分钟)
  scrape_interval: 15s
  # 告警规则评估频率(建议与抓取间隔一致)
  evaluation_interval: 15s
  # 抓取超时时间(默认10秒)

# 告警配置
alerting:
  alertmanagers:
    - static_configs:
        - targets:
          # 启用Alertmanager时需配置实际地址
          # - alertmanager:9093

# 规则文件配置
rule_files:
  # 告警规则文件路径(支持通配符)
  # - 'alert_rules/*.rules'
  # 记录规则文件路径
  # - 'recording_rules/*.rules'

# 监控目标配置
scrape_configs:
  # Prometheus自监控任务
  - job_name: "prometheus"
    # 监控目标(默认暴露在9090端口)
    static_configs:
      - targets: ["localhost:9090"]
        # 自定义标签(用于维度筛选)
        labels:
          app: "prometheus"
          env: "production"
本文作者:松轩(^U^)
本文链接:
版权声明:本博客所有文章除特别声明外,均采用 BY-NC-SA 许可协议。转载请注明出处!
目录