
Press Ctrl+ and K to search
请注意,本文编写于 100 天前,最后修改于 100 天前,其中某些信息可能已经过时。
目录
一、环境准备
1.准备两台服务器,一台用于安装Prometheus用于数据的采集,一台安装Grafana用于数据的展示
jshostnamectl set-hostname  prometeus
hostnamectl set-hostname  grafana
jscat >> /etc/hosts <<EOF
192.168.201.110 prometeus
192.168.201.111  grafana
EOF
2.同步服务器时间(很重要),因为普罗米修斯是时间数据库
jsyum install ntpdate -t
ntpdate -u ntp.aliyun.com
timedatectl set-timezone Asia/Shanghai
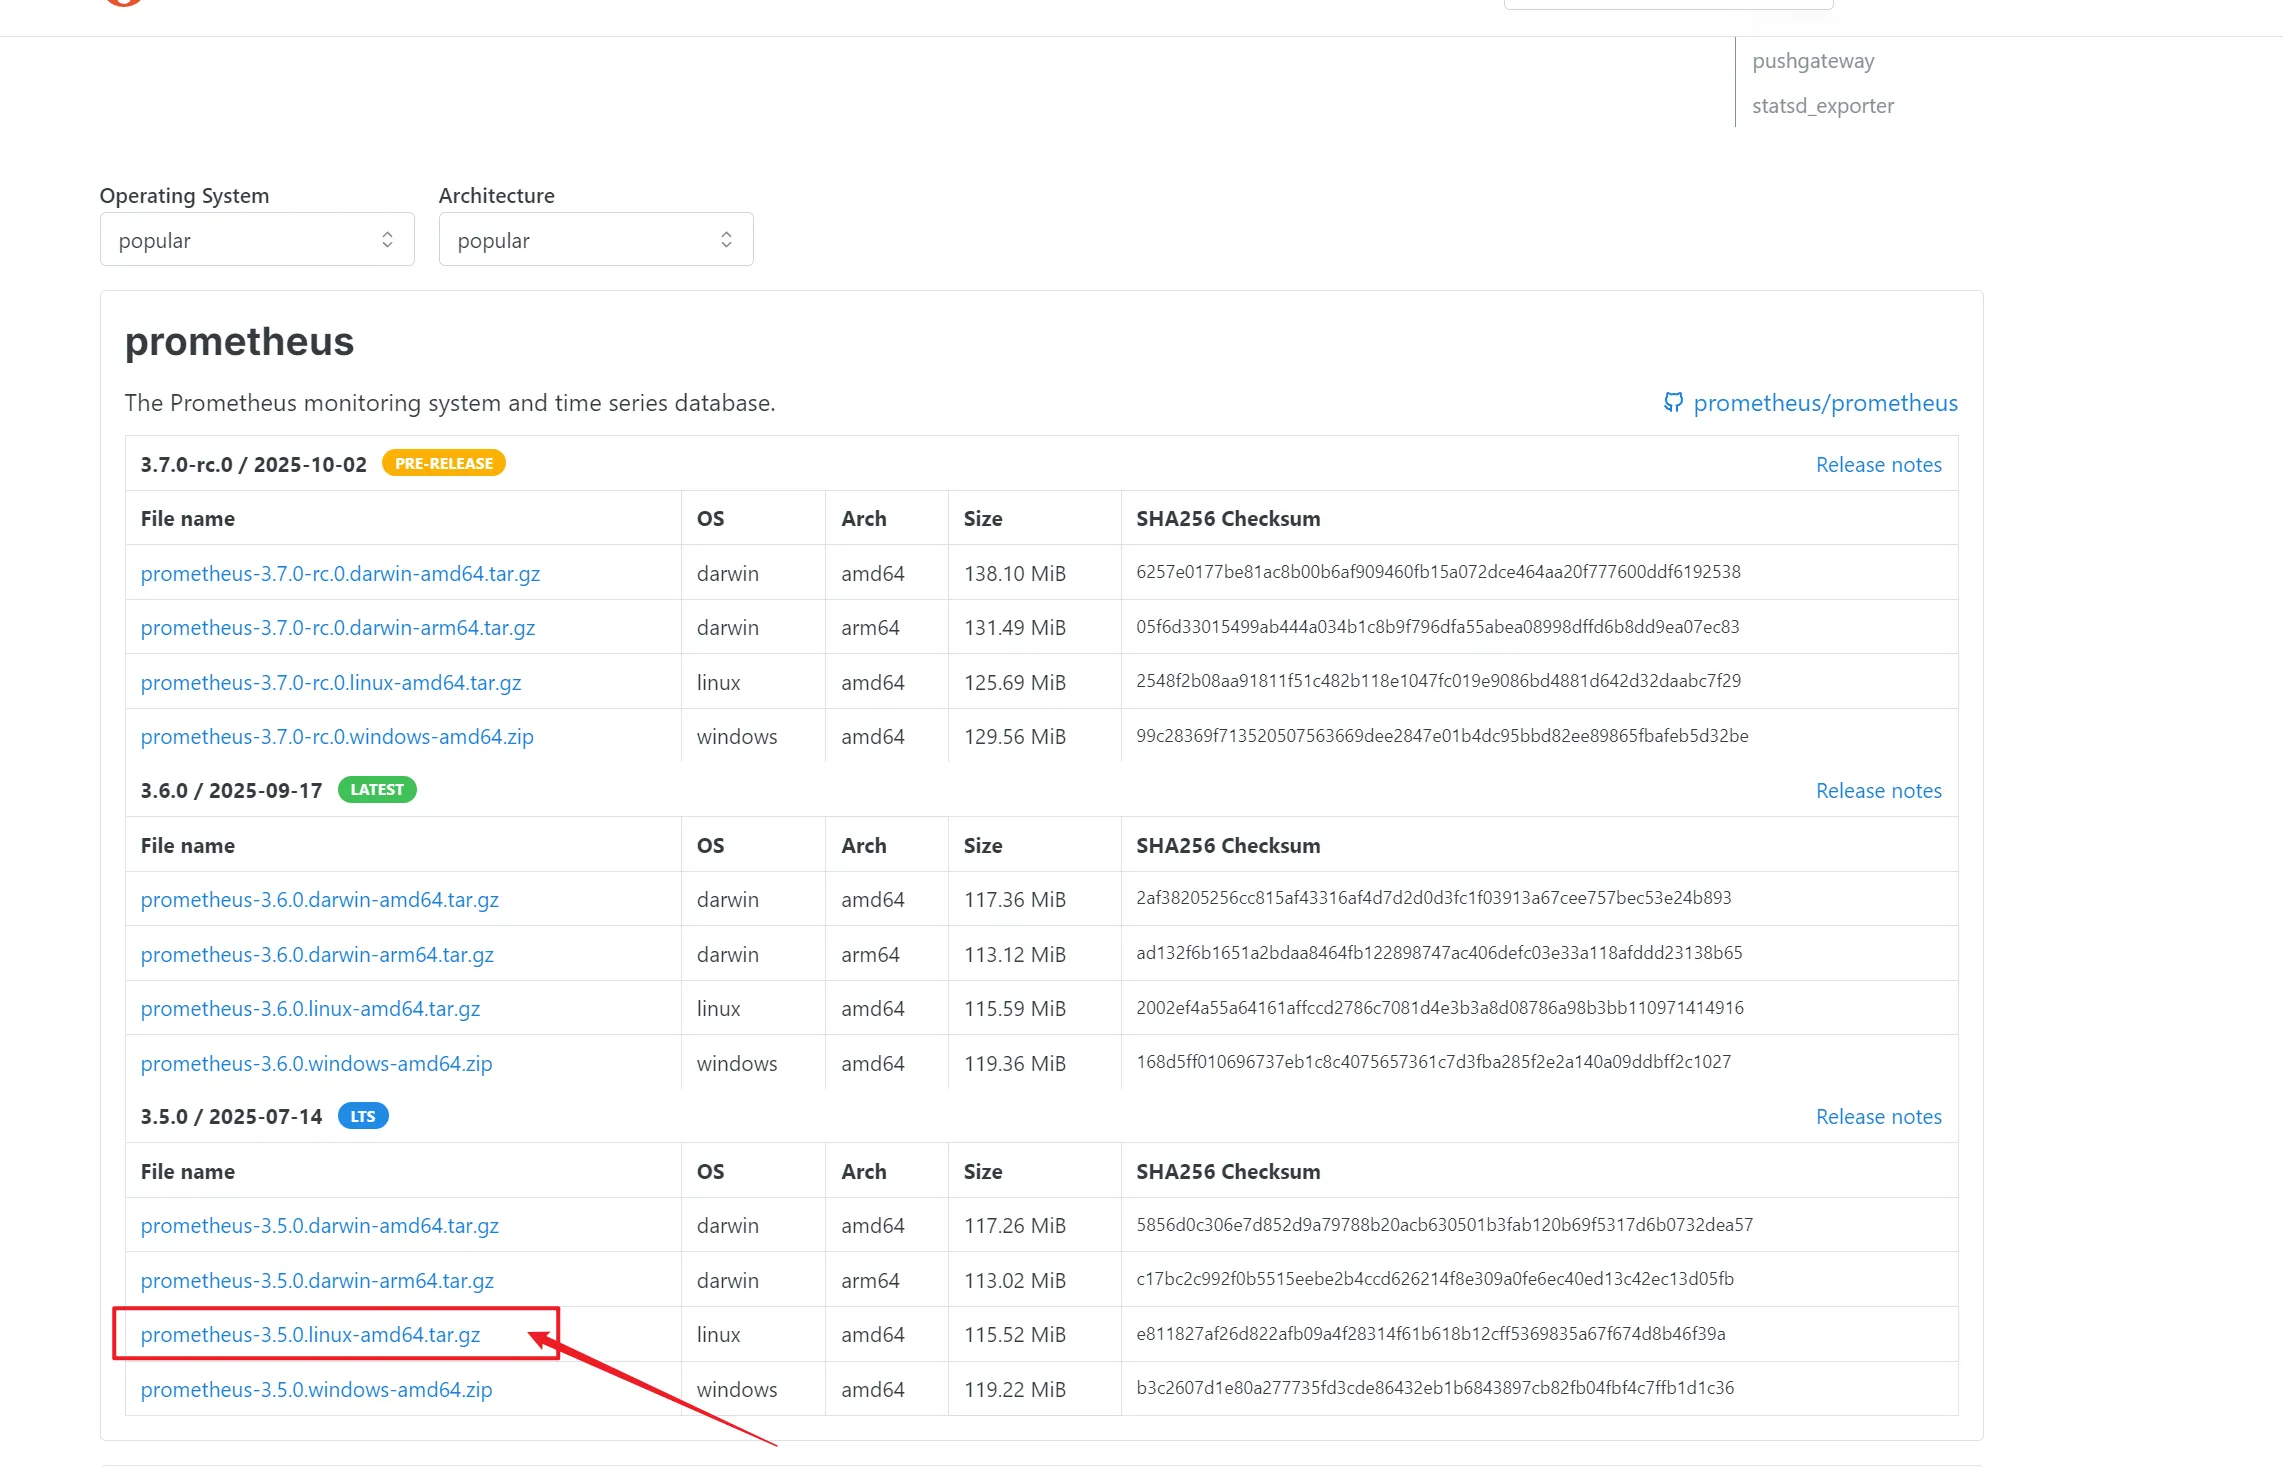
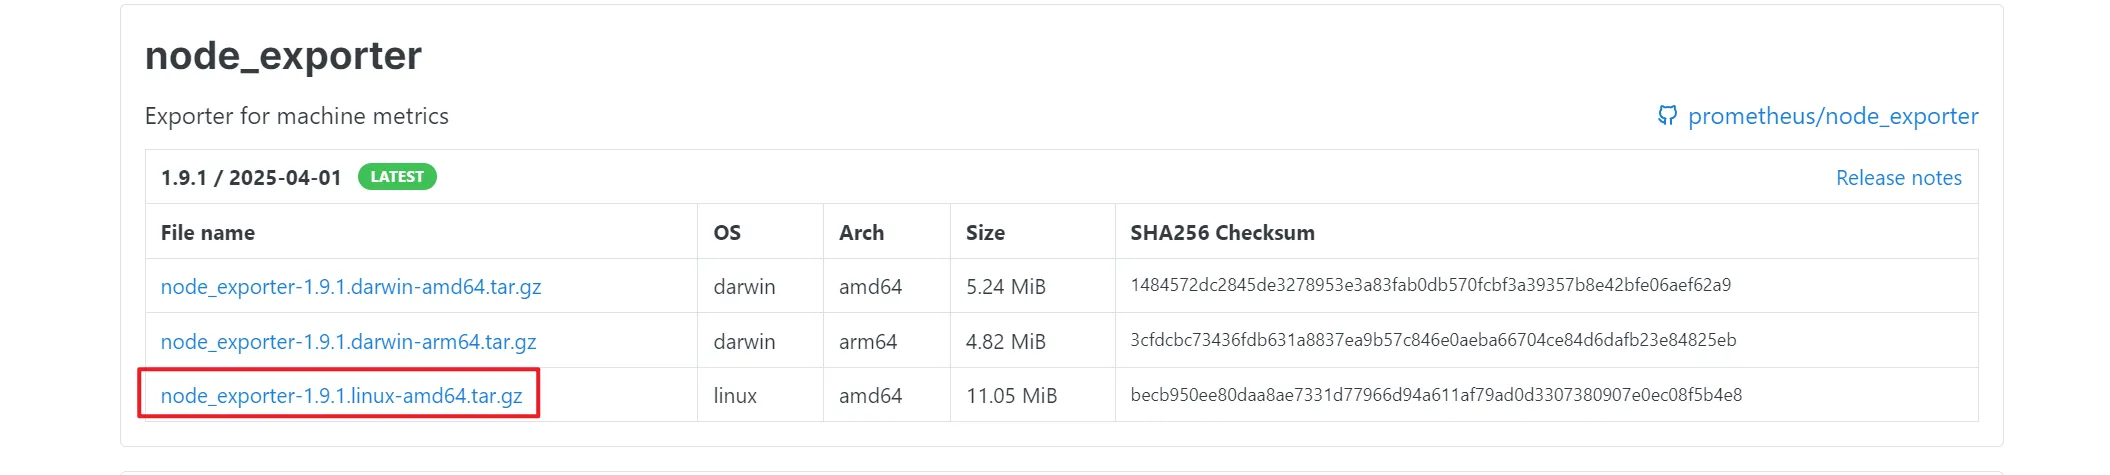
二、下载安装包
下载网址:https://prometheus.io/download/
下面是长期稳定版本
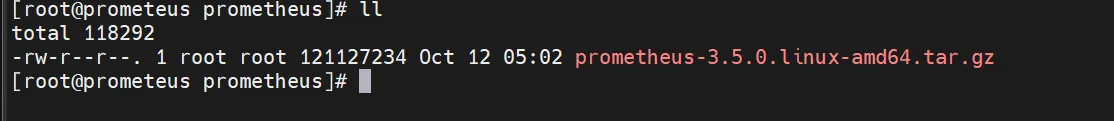
在Prometheus服务器创建一个文件目录,上传到该目录下
jsmkdir -p /server/prometheus
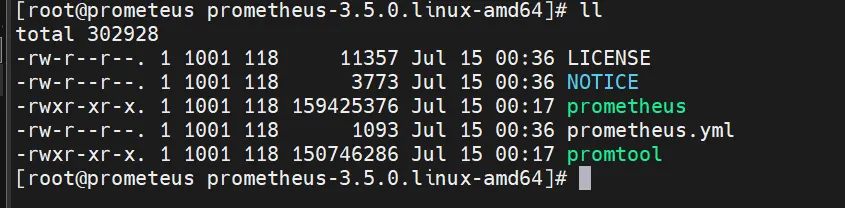
jstar -zxvf prometheus-3.5.0.linux-amd64.tar.gz
进入目录后,prometheus是命令,prometheus.yml是配置文件,两个最核心的东西。
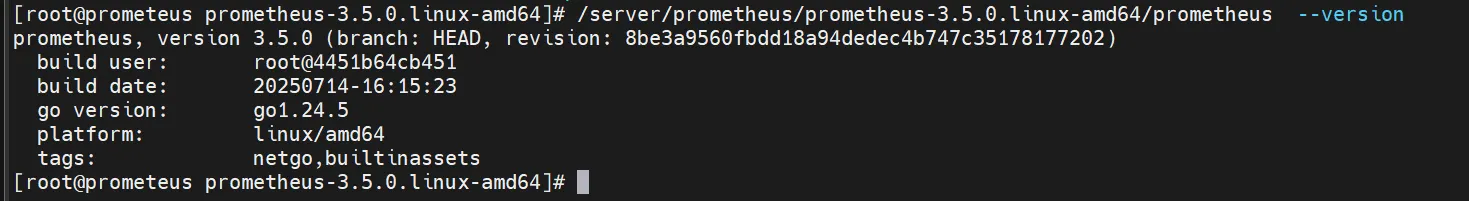
查看当前版本
js/server/prometheus/prometheus-3.5.0.linux-amd64/prometheus --version
启动prometeus
默认前台启动
js/server/prometheus/prometheus-3.5.0.linux-amd64/prometheus
后台启动
jsnohup /server/prometheus/prometheus-3.5.0.linux-amd64/prometheus &>>/server/prometheus/prometheus-3.5.0.linux-amd64/prometheus.log &
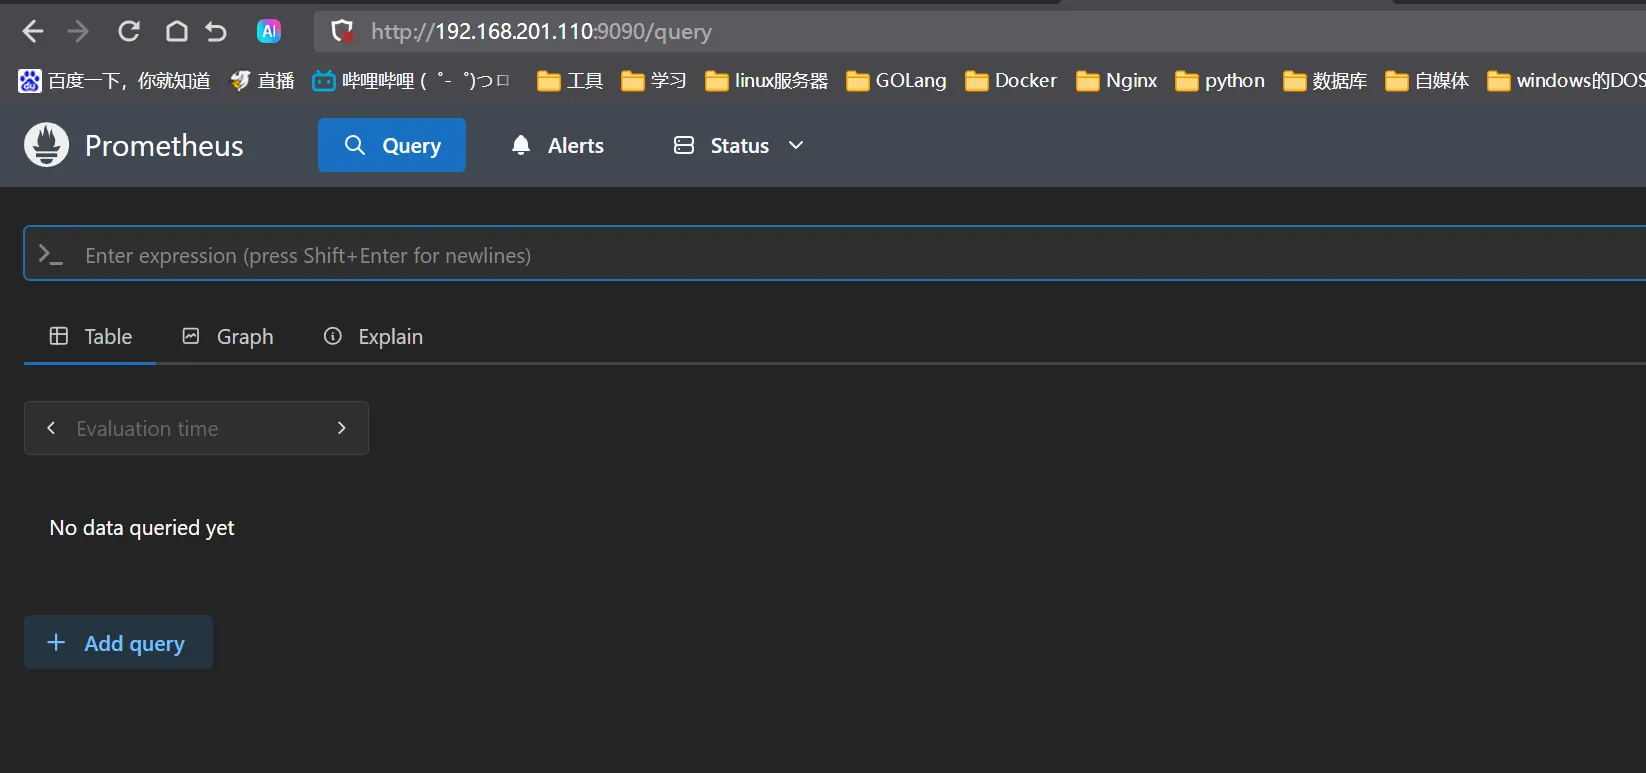
启动后,访问默认9090端口:http://192.168.201.110:9090/query
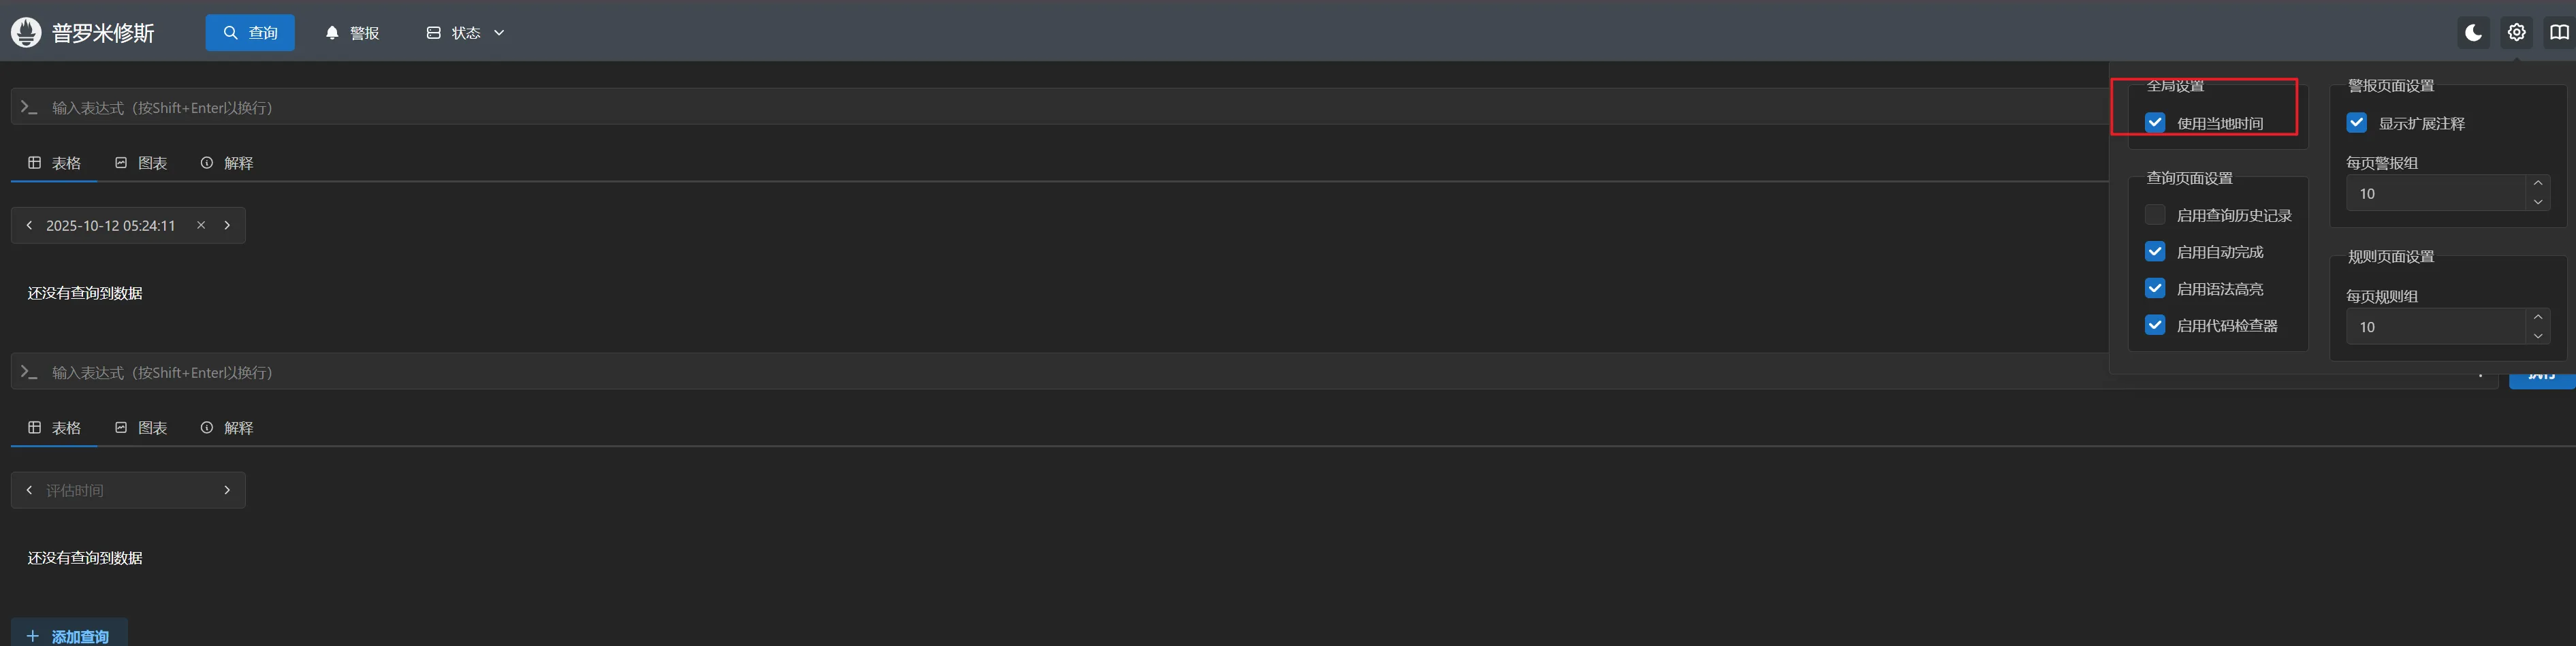
全局设置勾选
本文作者:松轩(^U^)
本文链接:
版权声明:本博客所有文章除特别声明外,均采用 BY-NC-SA 许可协议。转载请注明出处!
目录