
Press Ctrl+ and K to search
请注意,本文编写于 277 天前,最后修改于 276 天前,其中某些信息可能已经过时。
目录
一、介绍与安装
"白盒监控"--需要把对应的Exporter程序安装到被监控的目标主机上,从而实现对主机各种资源及其状态的数据采集工作。
但是由于某些情况下操作技术或其他原因,不是所有的Exporter都能部署到被监控的主机环境中,最典型的例子是监控全国网络质量的稳定性,通常的方法是使用ping操作,对选取的节点进行ICMP测试,此时不可能在他人应用环境中部署相关的Exporter程序。针对这样的应用的场景,Prometheus社区提供了黑盒解决方案,Blackbox Exporter无须安装在被监控的目标环境中,用户只需要将其安装在与Prometheus和被监控目标互通的环境中,通过HTTP、HTTPS、DNS、TCP、ICMP等方式对网络进行探测监控,还可以探测SSL证书过期时间。
blackbox_exporter
● Prometheus 官方提供的 exporter 之一,可以提供 http、dns、tcp、icmp 的监控数据采集
安装blackbox_exporter
jswget https://github.com/prometheus/blackbox_exporter/releases/download/v0.27.0/blackbox_exporter-0.27.0.linux-amd64.tar.gz
tar -zxvf blackbox_exporter-*.tar.gz
cd blackbox_exporter-*
启动
js./blackbox_exporter
二、配置普罗米修斯
js# 全局配置
global:
scrape_interval: 15s
evaluation_interval: 15s
# 告警配置
alerting:
alertmanagers:
- static_configs:
- targets: ['192.168.201.110:9093']
# 规则文件配置
rule_files:
- '/server/prometheus/prometheus-3.5.0.linux-amd64/alert_rules/*.rules'
# 监控目标配置
scrape_configs:
# 监控Prometheus自身
- job_name: "prometheus-server"
file_sd_configs:
- files:
- /server/prometheus/node_exporter.yml
refresh_interval: 5s
# 监控Nginx
- job_name: nginx
static_configs:
- targets: ['192.168.201.104:9113']
labels:
name: "nginx"
# 监控Kubernetes
- job_name: K8S
static_configs:
- targets: ['192.168.201.100:31666']
labels:
name: "k8s"
# 监控Redis
- job_name: redis
static_configs:
- targets: ['192.168.201.104:9121']
labels:
name: "redis"
# 监控Docker
- job_name: docker
static_configs:
- targets: ['192.168.201.104:8080']
labels:
name: "docker"
# 监控MySQL
- job_name: mysql
static_configs:
- targets: ['192.168.201.104:9104']
labels:
name: "mysql"
# 监控Blackbox Exporter自身
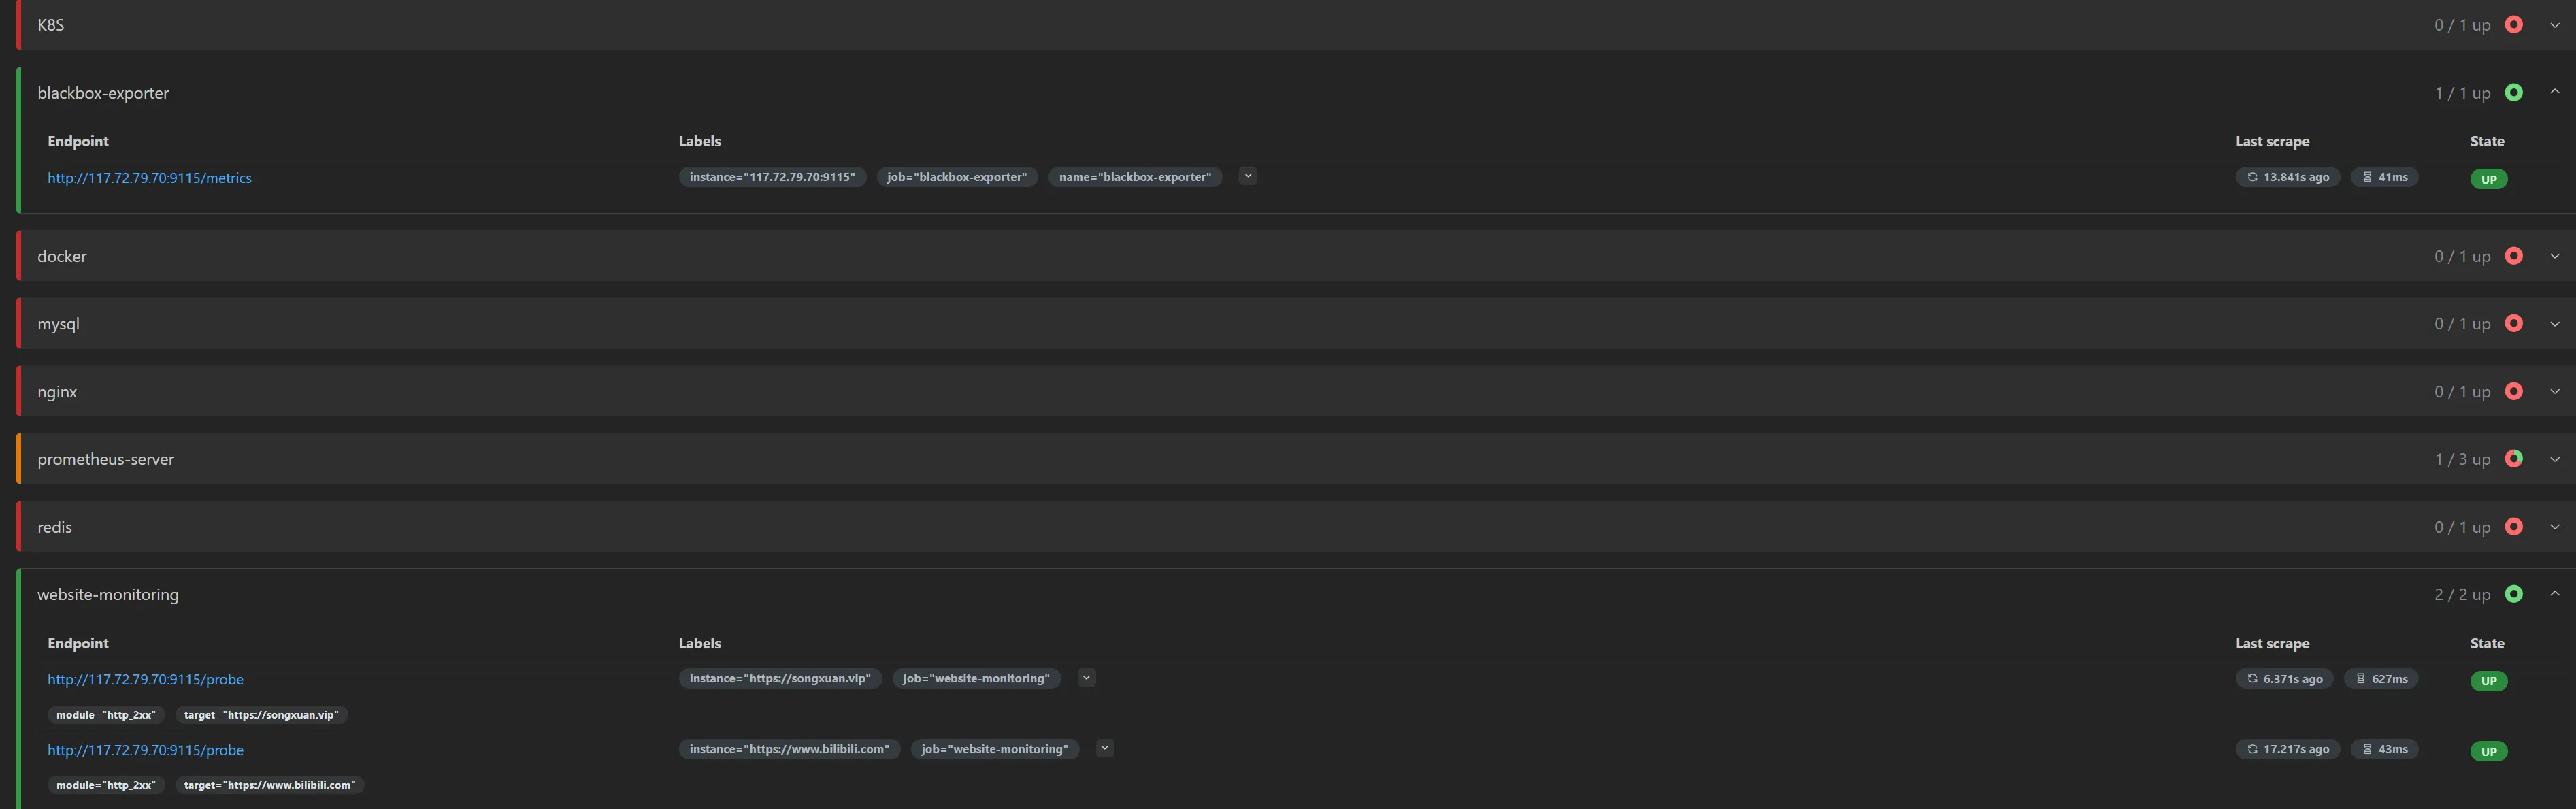
- job_name: 'blackbox-exporter'
static_configs:
- targets: ['117.72.79.70:9115']
labels:
name: "blackbox-exporter"
# 通过Blackbox Exporter监控外部网站
#http配置
- job_name: "blackbox_http"
metrics_path: /probe
params:
module: [http_2xx]
static_configs:
- targets:
- https://www.baidu.com
- https://songxuan.vip
- https://songxuan.vip/category/ELK
- https://www.baidu.com/
relabel_configs:
- source_labels: [__address__]
target_label: __param_target
- source_labels: [__param_target]
target_label: instance
- target_label: __address__
replacement: 117.72.79.70:9115
# 监控告警alertmanager9093端口
- job_name: alertmanager
static_configs:
- targets: ['192.168.201.110:9093']
labels:
name: "alertmanager"
jsprobe_success                   # 是否探测成功(取值 1、0 分别表示成功、失败)
probe_duration_seconds          # 探测的耗时

# 关于 DNS
probe_dns_lookup_time_seconds   # DNS 解析的耗时
probe_ip_protocol               # IP 协议,取值为 4、6
probe_ip_addr_hash              # IP 地址的哈希值,用于判断 IP 是否变化

# 关于 HTTP
probe_http_status_code          # HTTP 响应的状态码。如果发生重定向,则取决于最后一次响应
probe_http_content_length       # HTTP 响应的 body 长度,单位 bytes
probe_http_version              # HTTP 响应的协议版本,比如 1.1
probe_http_ssl                  # HTTP 响应是否采用 SSL ,取值为 1、0
probe_ssl_earliest_cert_expiry  # SSL 证书的过期时间,为 Unix 时间戳
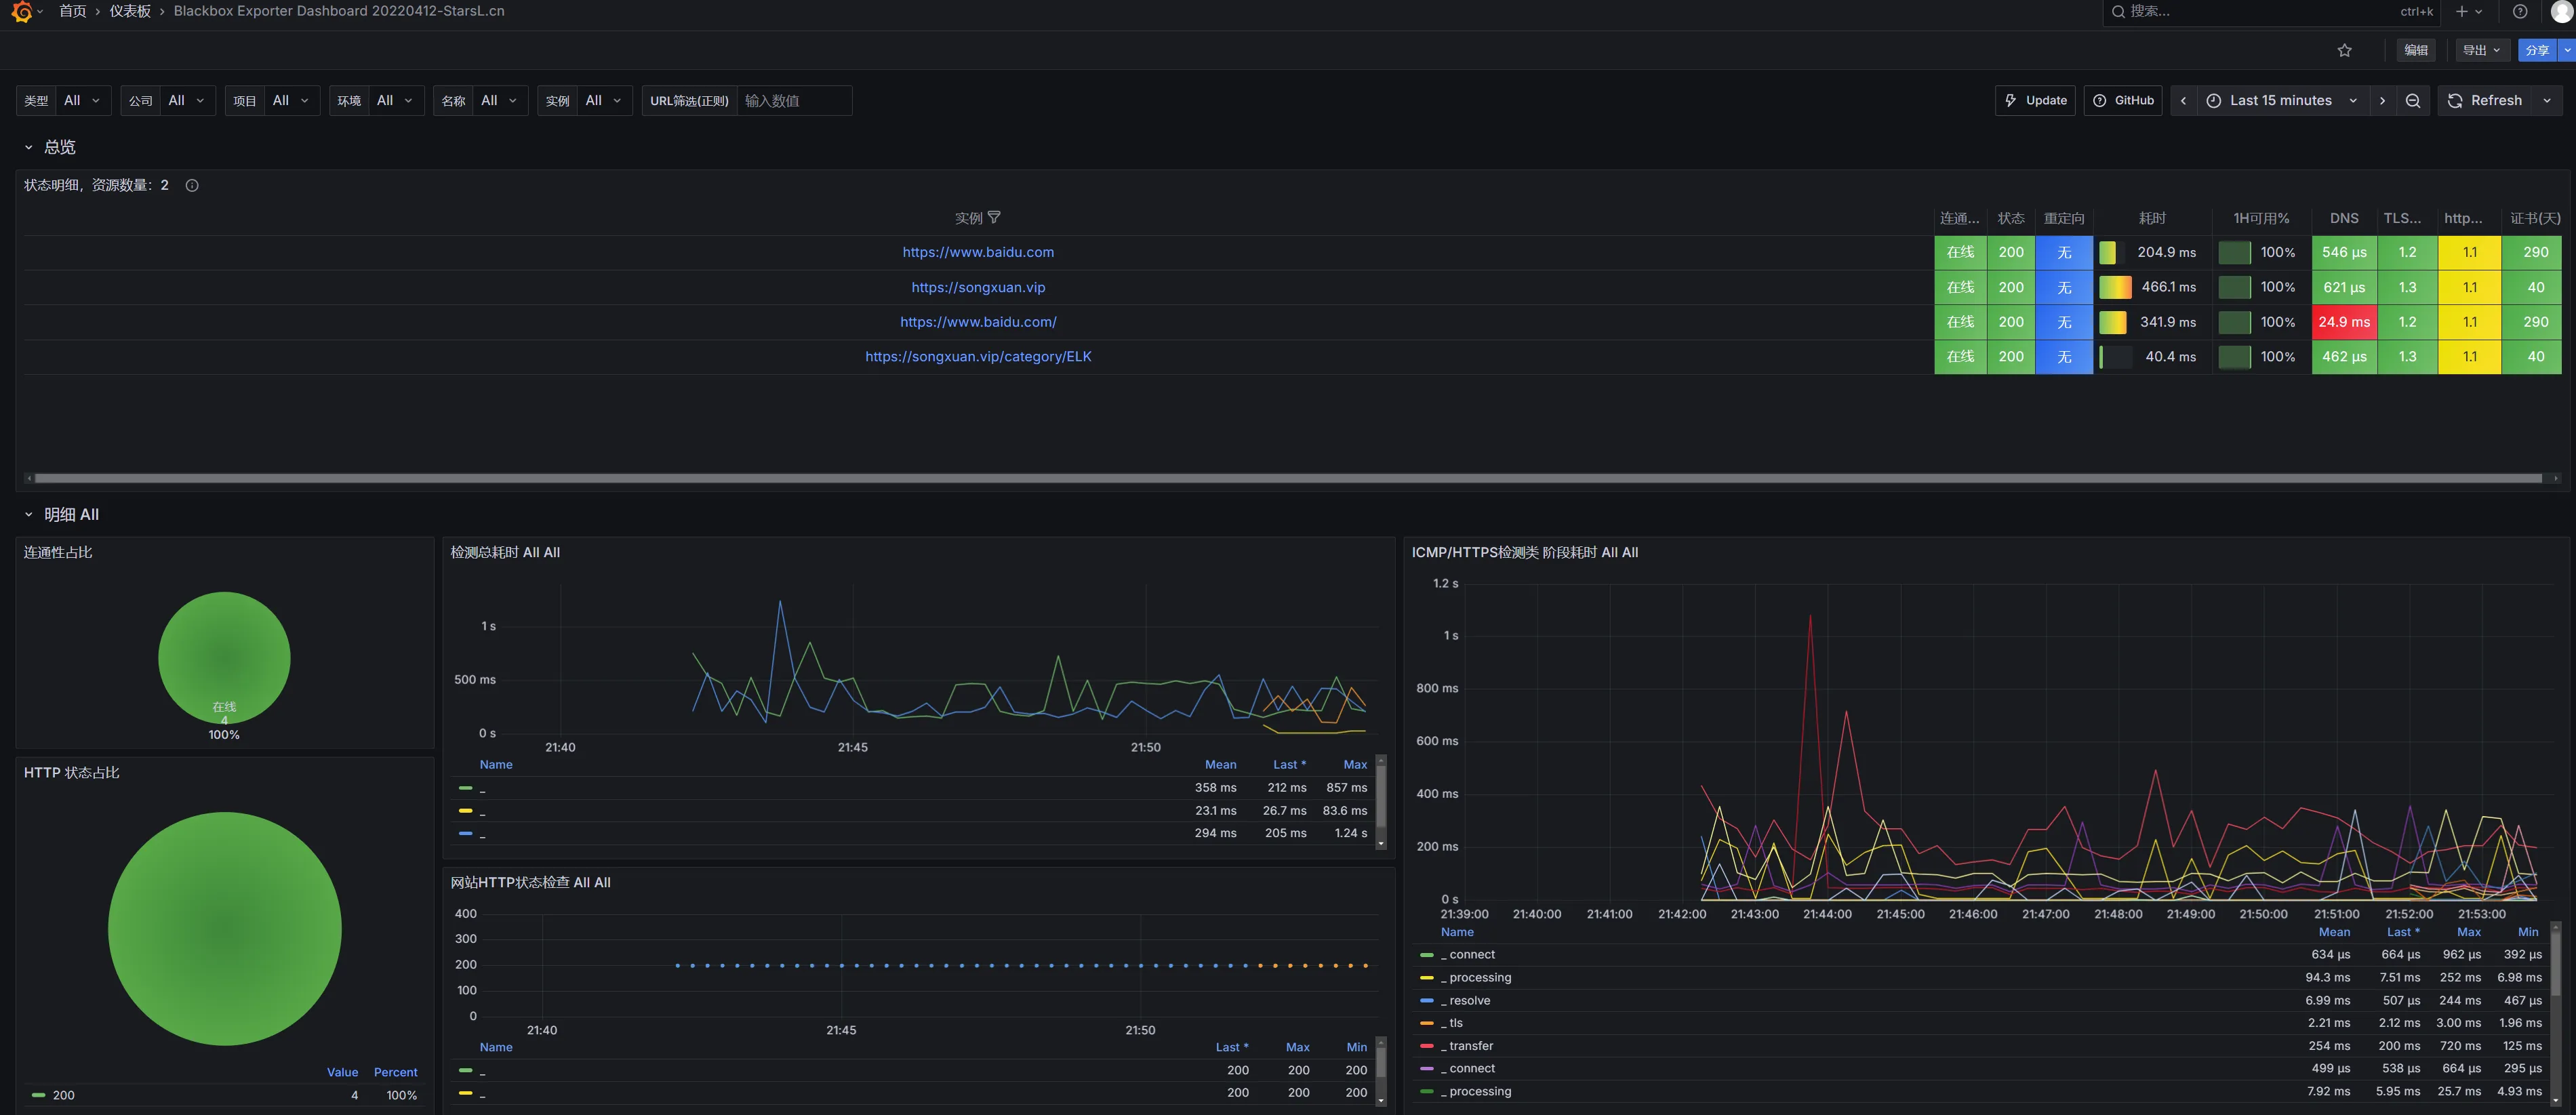
三、导入值班看板
9965、7587
本文作者:松轩(^U^)
本文链接:
版权声明:本博客所有文章除特别声明外,均采用 BY-NC-SA 许可协议。转载请注明出处!
目录